| AODV Image of the Handler:  |
Abstract: Wireless Mesh Networks (WMNs) are self-organising ad-hoc networks that support broadband communication. Due to changes in the topology, route discovery and maintenance play a crucial role in the reliability and the performance of such networks. Formal analysis of WMNs using exhaustive model checking techniques is often not feasible: network size (up to hundreds of nodes) and topology changes yield state- space explosion. Statistical Model Checking, however, can overcome this problem and allows a quantitative analysis.
In this paper we illustrate this by a careful analysis of the Ad hoc On- demand Distance Vector (AODV) protocol. We show that some optional features of AODV are not useful, and that AODV shows unexpected behaviour, yielding a high probability of route discovery failure.
Paper: pdf
Our models for AODV and its variants follow the same basic architecture in the network protocol layer. Each node maintains a message queue to store incoming messages and a processor for handling messages. Whilst the message queue is always enabled to receive messages, message handling can take time and so communication between queue and handler occurs only when the handler has successfully processed a message. The workflow of the handler is as follows: first, the next (oldest) message is loaded from its message queue. Depending on the type of message the routing table is updated and, if necessary, a new message is created, and either broadcast or unicast.
The specification of AODV offers optional features, which yield different variants of the routing protocol. One aim of this paper is to compare versions of AODV with different features turned on. Table 1 lists all variants of AODV that are modeled, analysed and compared with SMC-Uppaal, the the Statistical extension of Uppaal.
| name | optional features | remark |
| basic | none | |
| resend | resending RREQ | "standard" configuration of AODV |
| dflag | D-flag | the flag is set for all route discovery processes |
| dflag_res | D-flag and resending | this configuration has a flaw |
| dflag_res' | D-flag and resending | not following the RFC literally, but flaw fixed |
| repair | local repair | use local repair |
The Uppaal and SMC-Uppaal models can be downloaded here:
| AODV Image of the Handler: |
Connections between nodes are given by a connectivity graph or topology, defined by a Boolean-valued array and accessed via a function isconnected(i)(j), which returns true whenever i and j are connected.
To analyse quantitative properties of AODV and to compare different variants in a dynamic network, we use a topology-based mobility model. It reflects the impact of mobility on the network topology and distinguishes static and mobile nodes; only connections to and from mobile nodes can change. Each movement is characterised either by adding a new link to or by removing an existing link from the connectivity graph. Whenever a mobile node M enters the transmission range of a node A, a new link is established between M and A. If M leaves the transmission zone, the link between these two nodes is removed.
To decrease the number of possible topology changes due to a large number of mobile nodes, we set up the topology as follows: the network consists of 16 static and one mobile node. The static nodes form a 2-dimensional rectangular grid with grid size 1, i.e. the smallest distance between two nodes is 1 unit (cf. Fig.1(a)); the transmission range is set to 1.25. In reality, 1 unit might correspond to 100 metres, the transmission range to 125m, a realistic value.
The transmission ranges of the nodes Aij (1≤i,j≤4) split the grid into 102 different zones. The different zones are shown in Fig. 1(b). When a mobile node M moves within a zone, the exact position of the node does not matter, since it does not enter or leave the transmission range of any node---the connectivity graph stays the same.
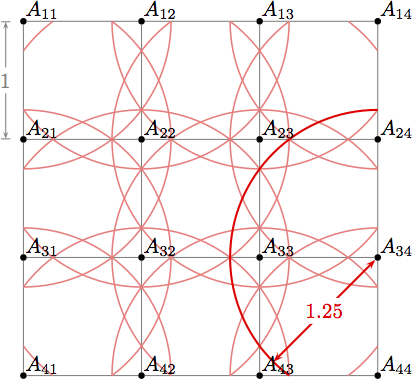 | 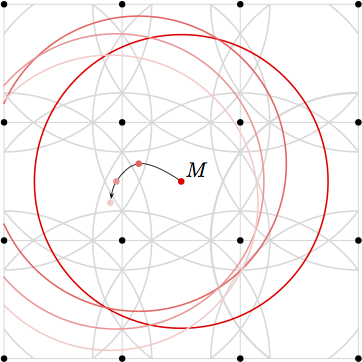 | |
| (a) grid with 16 nodes (static topology) | (b) node moving between zones (transmission ranges are indicated) |
Our experiments analyse the impact of mobile nodes and dynamic topologies on AODV; they are grouped into several categories: the first category analyses the probability of route establishment for a single route discovery process, i.e., an originator node oip is searching for a route to dip; the second category analyses the likelihood of route establishment between oip and dip when additional route discovery processes occur; the last category changes the speed of the mobile node.
Our first experiment is based on 17 nodes; 16 forming a grid (Fig. 1(a)) and one mobile node M which is located in the middle of the grid at the beginning of the experiment. After a delay between 140 and 160 time units (the time that the mobile node needs to perform four movements) a data packet is injected. This initial delay gives a "pseudo-random" position for the mobile node.
The data packet is injected at node A11, its destination is A44. Since node A11 does not know a route to the destination, it initiates a route discovery process. We are interested whether (and at which time) $A_{11$ establishes a route to A4. In Uppaal syntax this reachability property is
| model | conf. level | probability interval | discovery time (avg.) | running time of Uppaal |
| basic | 95% | [ 55.4336 , 65.4336 ] | 595.67 | 4m18s |
| basic | 99% | [ 59.7806 , 61.7806 ] | 597.52 | 157m44s |
| resend | 95% | [ 95.00 , 100.00 ] | 847.04 | 6m03s |
| resend | 99% | [ 98.9623 , 100.00 ] | 836.87 | 209m43s |
| dflag | 95% | [ 54.4851 , 64.4851 ] | 597.50 | 4m52s |
| dflag | 99% | [ 59.5655 , 61.5655 ] | 597.63 | 164m21s |
| dflag_res | 95% | [ 64.5122 , 74.5122 ] | 698.70 | 7m47s |
| dflag_res | 99% | [ 68.2133 , 70.2133 ] | 688.79 | 249m12s |
| dflag_res' | 95% | [ 81.3144 , 91.3144 ] | 822.89 | 7m08 |
| dflag_res' | 99% | [ 83.4104 , 85.4104 ] | 807.43 | 230m57 |
| repair | 95% | [ 59.7696 , 69.7696 ] | 607.86 | 7m31s |
| repair | 99% | [ 63.5742 , 65.5742 ] | 606.53 | 165m11s |
The results are summarised in Table 2. Full results (as produced by SMC-Uppaal) can be found here.
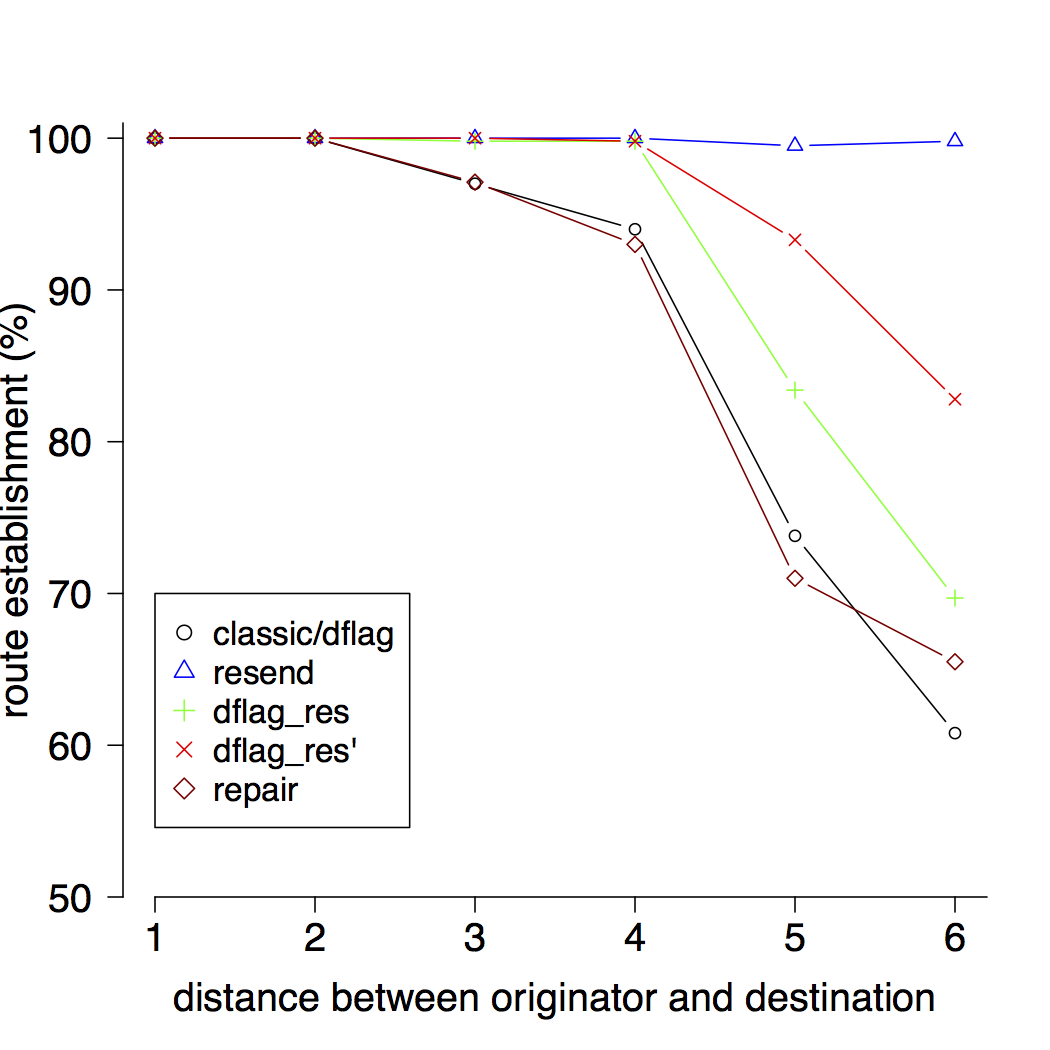
The first set of experiments considered a data packet to be sent from A11 to A44, the largest distance a packet can travel in our set up. We expected to see the clearest results by using this distance. However, we also performed experiments with all other pairs of nodes. The output can be found and downloaded in Table 3.
| model | Uppaal data |
| basic/dflag | AODV_basic_1RREQ_i_to_j.txt |
| resend | AODV_resend_1RREQ_i_to_j.txt |
| dflag_res | AODV_dflag_res_1RREQ_i_to_j.txt |
| dflag_res' | AODV_dflag_res_fix_1RREQ_i_to_j.txt |
| repair | AODV_repair_1RREQ_i_to_j.txt |
Fig.2 gives some impressions about the results. It illustrates the probability of route-discovery (y-axis) depending on the distance between originator and destination (x-axis). Of course, the larger the distance between originator and destination, the smaller the chance of route establishment. Interestingly, there is a clear drop down at a distance of four nodes.
 |
In order to evaluate the performance of variants of AODV under different network (traffic) load, we check the probability of route discovery when two data packets are injected to the network. For this second category of experiments, we are again interested in a route from A11 to A44. However, shortly (35-45 milliseconds) after the packet is handed over to A11, a second data packet is injected at another node, destined for some destination; in fact we did experiments for all destinations. Table 4 provides all necessary data (unedited and unsorted as produced by our scripts and Uppaal).
| model | Uppaal data |
| basic | AODV_basic_2RREQ_2_to_17_i_to_j.txt |
| resend | AODV_resend_2RREQ_2_to_17_i_to_j.txt |
| repair | AODV_repair_2RREQ_2_to_17_i_to_j.txt |
Contact: Peter Höfner: peter.hoefner <at> nicta.com.au
Last update: 2013